What is Body Composition?
Body composition is the distribution of fat, muscle, bone, and water in the human body. This distribution of tissues is critical to understanding individuals’ metabolic health, physical performance, and disease risk. Evidence increasingly suggests that higher body fat leads to higher disease burden and is associated with higher risk of all-cause mortality1. Fortunately, body composition is highly modifiable by lifestyle intervention and easily measured with available technology!
BIA Technology
One of these technologies is the BIA or Bioelectrical Impedance Analysis, a noninvasive and reliable way to measure body composition. You have seen these machines before in your local gym or doctors’ office; they look like scales usually with electrode handles for you to hold. This technology works by applying a low intensity electric current to the body and measuring the impedance (interference) values reported by the analyzers. Some tissues like Bone, Fat, and Air in the body are poor conductors of electricity2 while water rich tissues like healthy muscle are good conductors allowing the BIA to categorize and measure what the electrical signal is traveling through.
Key Metrics to Track
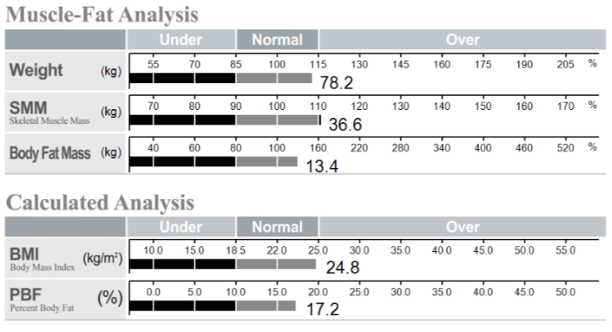
Some key metrics to track on your results sheet are pictured below. SMM is your skeletal muscle mass which is critical to maintaining your metabolism and physical capacity. BMI is your weight in kilograms divided by your height in meters squared and is a top predictor of many diseases as well as PBF or percent body fat, the proportion of your body that is fat.
Understanding Your Results
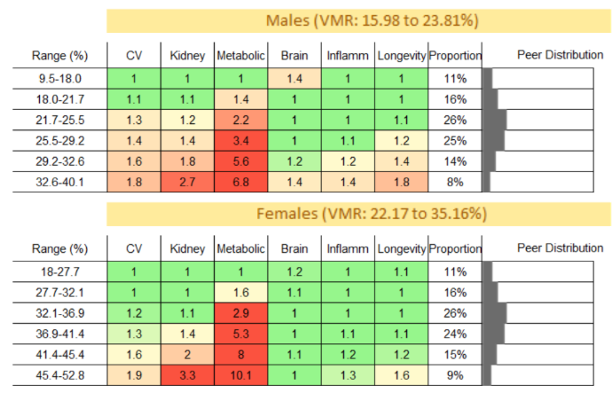
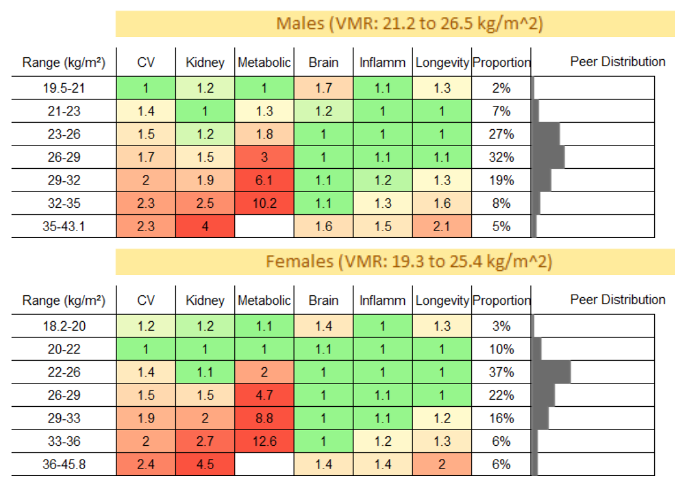
Understanding where you should be for these metrics can be confusing and you may hear conflicting information from different sources. To this end we created the Biomarker Reference Guide™ within the VOLO™ Score system to help you understand what the data say are the healthiest levels for these markers based on predicted 15-year disease risk based on research and data science modeling in large population datasets. The VMR™ (VOLO™ Modeled Range) provided in our system and guides is based upon the optimal range of 15 year predicted risk correlated with the best VOLO™ Scores across all our modeled health domains. If we look at the graph below displaying Risk Multiplier (RM) to the optimal levels (VMR), we can see the VMR for males across all health domains is from 15.98% to 23.81% body fat percent and from 22.17% to 35.16% for females. For BMI we can see that for males the VMR is 21.2 to 26.5 and 19.3 to 25.4 for females.
Once you have your results you can identify your Risk Multiplier on the charts below. For example, if I am a female with 42% body fat, I can see that I have 8 times higher risk of developing metabolic disease when compared to my peers.
Body fat percentage
Body Mass Index (BMI)
Get your measurements and set your goals toward a healthier lifestyle and body composition!